Data Management
Can better data structure improve reporting?
Our team analysed a merchant data management problem, mapped flows and relationships, and documented a proposed relational SQL prototype.
A normalised six table schema with keys and history, plus seven analytical queries.
Explore the evidence ↓01 · Decision
Our team defined the decision before selecting a method.
How could clearer data flows and relational structure support more reliable reporting for an Uber Eats style operating model?
A diagram had to become a database that could answer questions.
Our team moved from data flow analysis to entity relationships and a proposed SQL prototype. The flat file had one table, no enforced keys and a single scan date, so the new schema separates location, delivery, status, reviews, promotions and scans, each with its own history.
Where the work could be stronger
The group report identifies substantial missing merchant fields. Adding reproducible test cases would make the prototype checkable by another analyst.
02 · Approach
Our team organised the analysis in the following sequence.
- 01
Our team defined the business problem and reviewed the organisation’s data management context.
- 02
We mapped the movement of data with a data flow diagram and modelled the relational structure with an entity relationship diagram.
- 03
We translated the ERD into a normalised six table schema with primary and foreign keys and a recorded_at timestamp on each dependent table, so fees, availability and ratings could be tracked over time.
- 04
We wrote seven analytical queries, including window functions to rank merchants by rating within each city and aggregations to segment performance by price tier.
03 · Evidence
The results support the following interpretation.
The submitted coursework identifies 997 missing delivery fee values out of 1,000 merchant records (99.7%) Review ratings were missing for 58.2%, and 98.6% of merchants were recorded as closed; with a single scan date for every record, genuine closures could not be told apart from merchants that were simply closed at scan time. The proposed six table schema and seven analytical queries were designed to make pricing, performance benchmarking and promotion analysis reliable.
Scope: assessed four person team prototype; production deployment falls outside the project evidence.
Our four person team analysed a 1,000 record Alabama merchant dataset. Delivery fee values were missing in 997 records (99.7%), while promotions were absent in 890 records (89.0%). These are findings about the coursework dataset, not claims about Uber Eats’ production systems.
What the proposed schema addressed
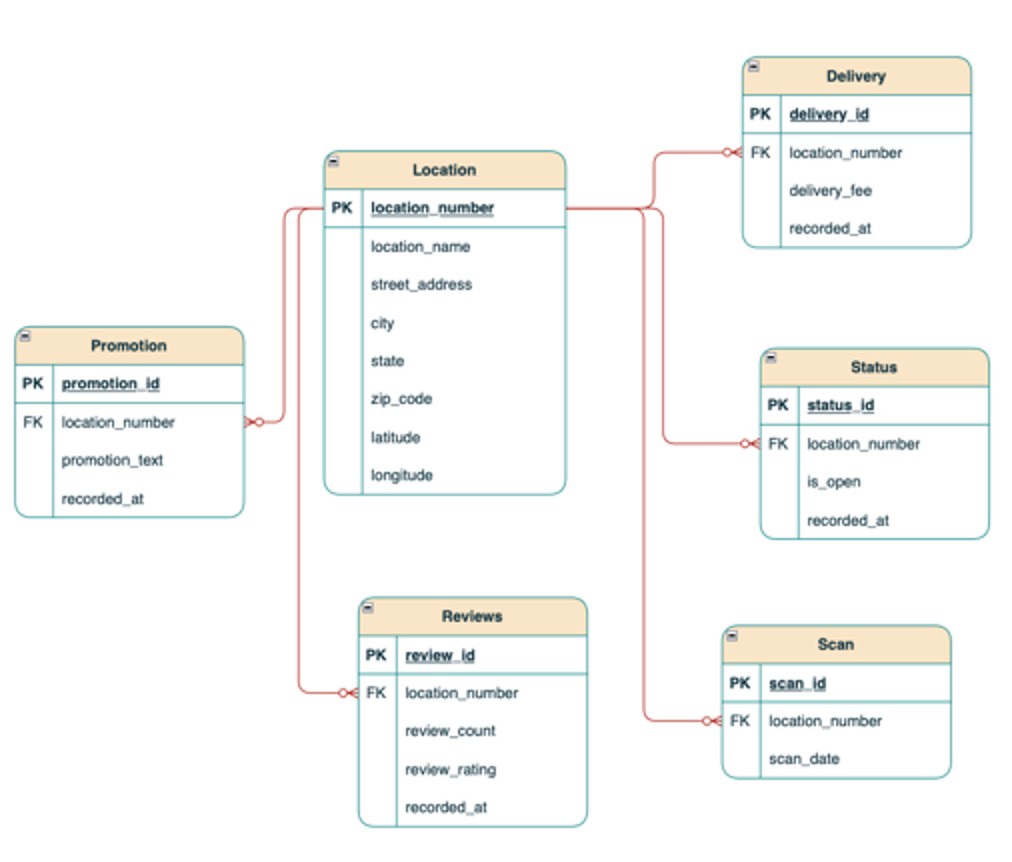
The team proposed separating merchant identity from changing operational information in six related tables. The submitted assignment includes a proposed entity relationship diagram and describes a SQL prototype. No production deployment or achieved commercial improvement is claimed.
Seven analytical questions described in the report
- Rank merchant ratings within each city.
- Compare delivery fees and their data coverage across cities.
- List promotions alongside review performance.
- Identify high rated merchants with active promotions.
- Summarise performance by price category.
- Assess delivery time and fee coverage by city.
- Profile open merchants using available operational fields.
These are the report’s descriptions of the seven query purposes; the scripts themselves are not published.
Source: Data Management Group Assignment, submitted MSc coursework. Group work is attributed to the team, not solely to Daniel.
The group’s proposed ERD links a central Location record with Delivery, Status, Promotion, Reviews and Scan. It is a coursework design proposal, not an image of a deployed Uber Eats database.
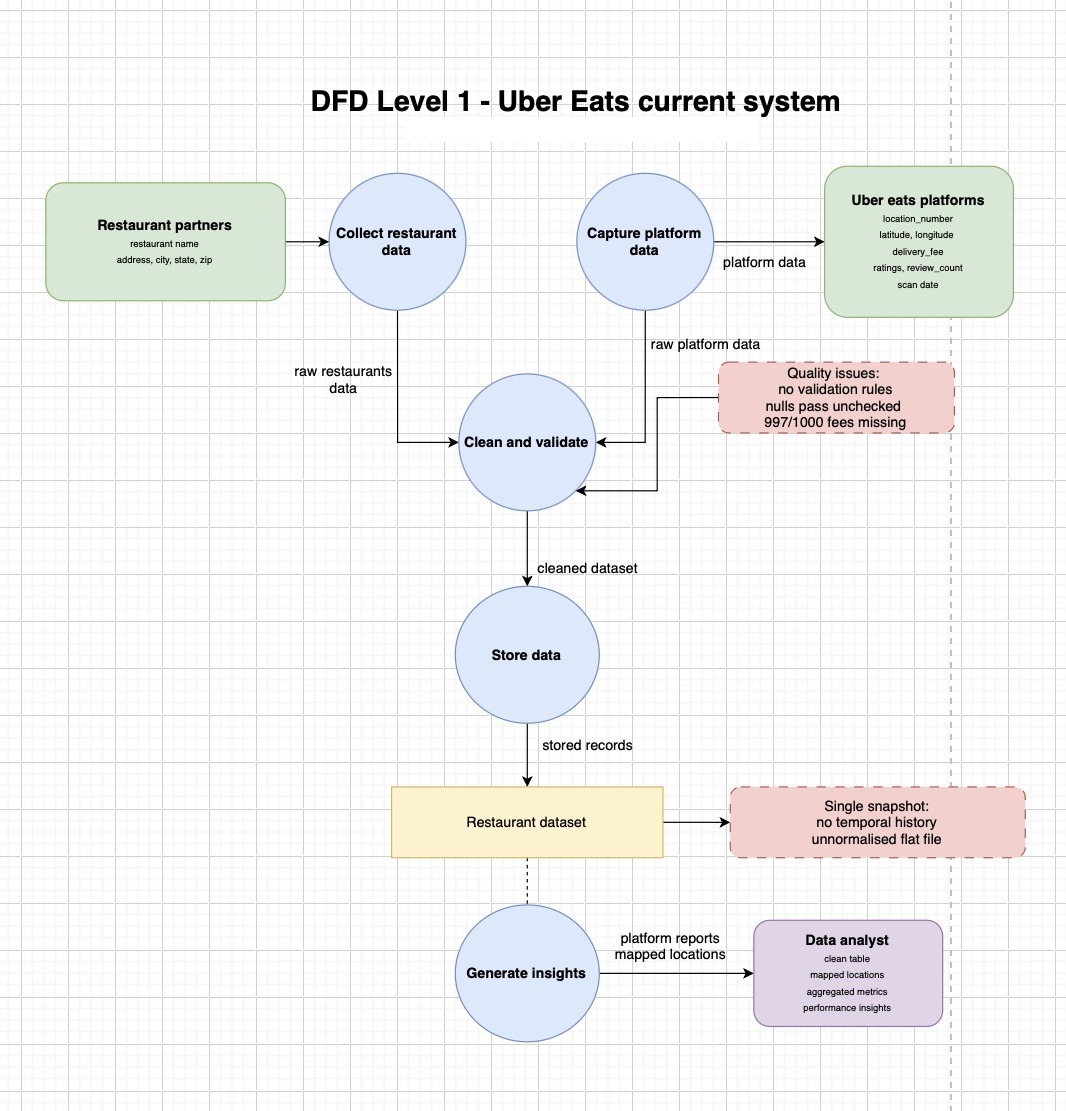
Before: submitted current state data flow
The team mapped where merchant and platform records move and annotated the source data quality issues. This is a coursework process model, not an observed view into a live platform.
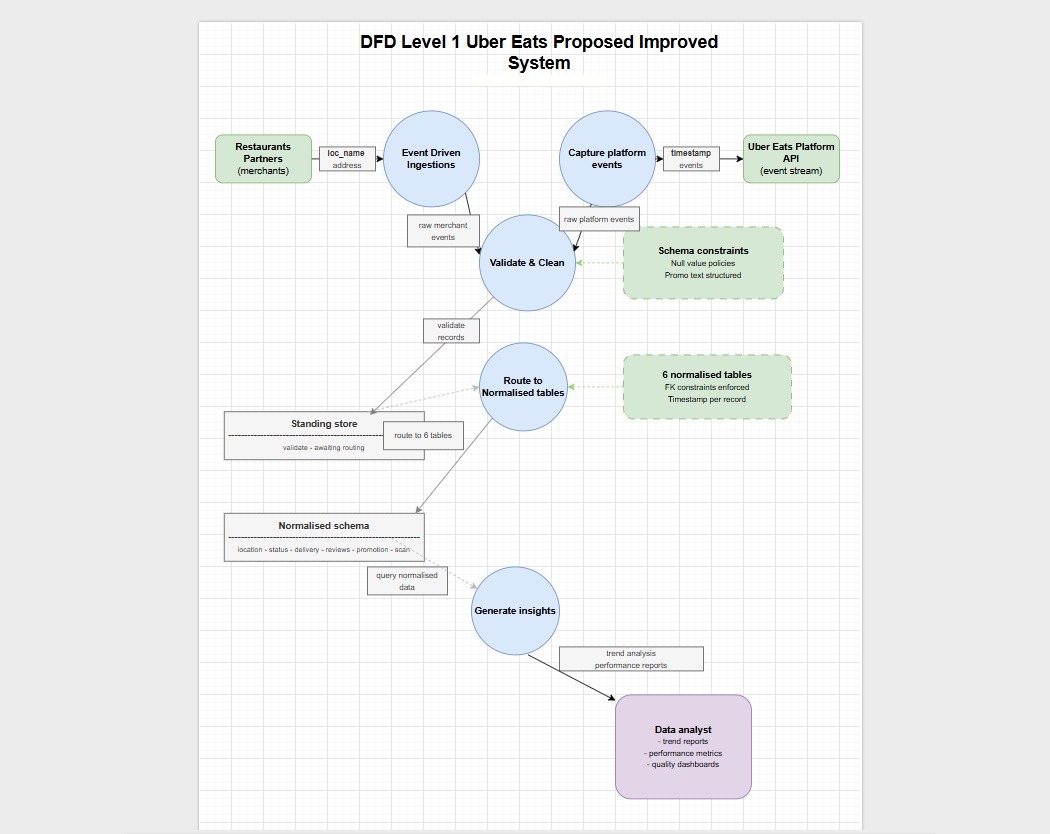
After: proposed improved data flow
The group’s proposed design routes merchant and platform events through validation and cleaning toward a normalised schema and analytical reporting. Proposed controls are design intentions, not implemented production changes.
Source: original ERD and current/proposed DFD figures from the submitted Data Management group report.
Explore the model in 3D
Conceptual relational structure from the team project. The displayed entities and links are illustrative, not the submitted ERD or a production database.
Read the supporting case ↗04 · Decision implications
Our team translated the analysis into practical next steps.
- Agree the business entities and relationships before building reports on top of them.
- Use the same business rules in the conceptual model and the implemented schema.
- Test the database through decision relevant queries rather than treating creation as the finish line.
05 · Limits
The evidence has defined limits.
This was assessed group coursework on a public merchant dataset, not Uber Eats production work, and the SQL scripts are not published.
06 · Next iteration
Our team would strengthen the next iteration.
Publish the SQL queries, sample result sets and explicit tests with accurate group attribution.
07 · Attribution
I distinguish my contribution from the complete project output.
There were no fixed specialist roles. We divided the work as evenly as possible across four people and shared coverage of the report, modelling and SQL prototype.
Toolkit