Customer Intelligence
What connects personalisation to loyalty?
I investigated whether perceived AI driven personalisation was associated with customer loyalty and whether customer trust statistically mediated that relationship.
01 · Decision
The study in one minute.
Is perceived AI driven personalisation associated with loyalty among UK online shoppers, and is that association statistically mediated by trust?
My contribution
I designed the survey, checked the data and analysed 139 complete eligible responses. I assessed the measurement scales before examining the relationships between personalisation, trust and loyalty.
The finding that matters
When trust and personalisation were considered together, trust remained statistically associated with loyalty. Personalisation’s direct coefficient was small and not statistically significant. The estimated indirect effect through trust was .303, with a 95% bootstrap interval from .199 to .422.
What I would recommend
Evaluate personalisation alongside customer trust, transparency and control. Test changes experimentally and measure actual behaviour before claiming an improvement in loyalty.
What this does not prove
This survey captures associations at one point in time. It does not show that personalisation causes trust or loyalty, or that the findings represent every UK shopper.
Read the results and supporting explanation02 · Approach
I organised the analysis in the following sequence.
- 01
Designed and distributed a cross sectional Qualtrics survey using convenience and snowball sampling.
- 02
Checked consent, eligibility, completeness, value ranges and duplicate responses; preserved the raw export and created a locked SPSS dataset.
- 03
Assessed scale reliability and factor structure using Cronbach’s alpha, KMO, Bartlett’s test and exploratory factor analysis.
- 04
Ran Pearson correlations, HC3 robust regression, diagnostics and PROCESS Model 4 mediation with 10,000 bootstrap samples.
- 05
Used Python for two figures and retained reproducible SPSS syntax.
03 · Evidence
The results support the following interpretation.
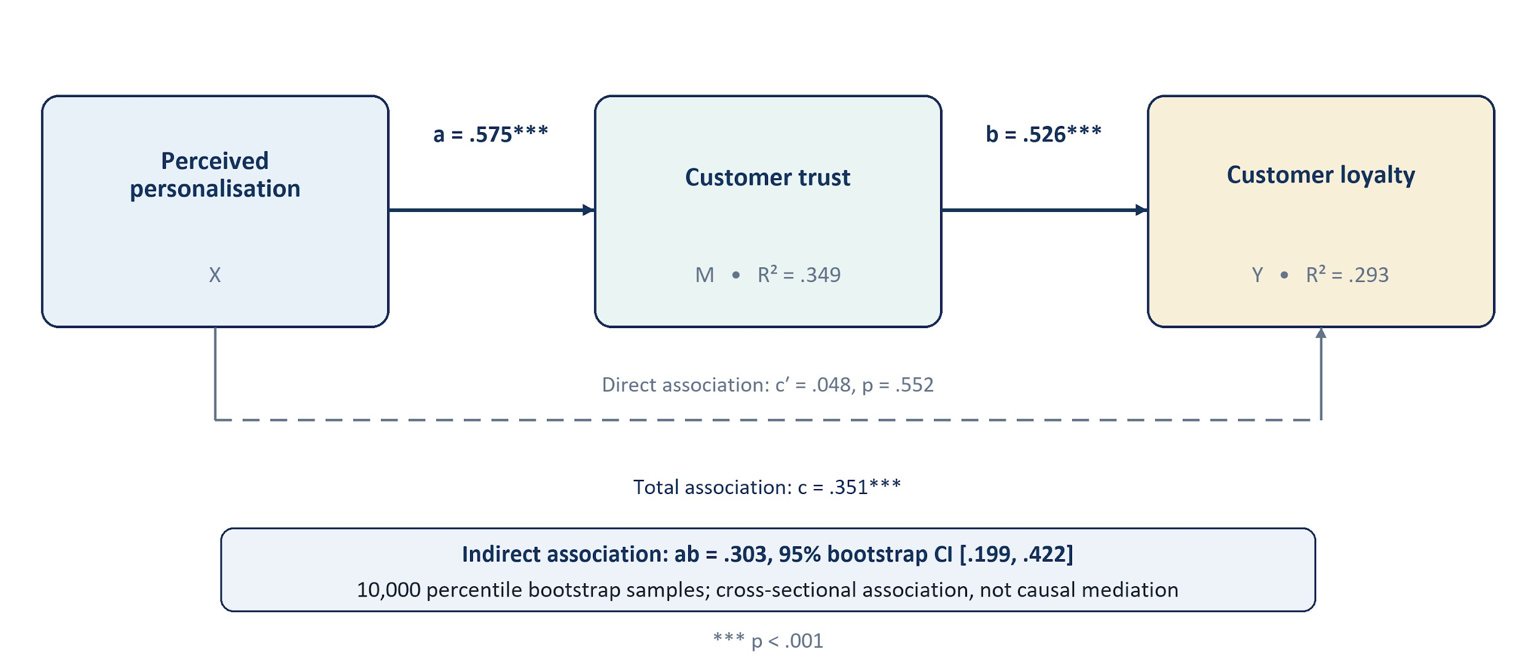
Personalisation and trust were positively correlated (r = .591, p < .001). In the trust regression model, personalisation was statistically associated with trust (R² = .349, B = .575). In the joint loyalty model, trust remained material (B = .526, p < .001), while personalisation’s direct coefficient was small and nonsignificant (B = .048, p = .552). The indirect effect through trust was .303 with a 95% bootstrap interval of [.199, .422].
Cross sectional association; causal inference falls outside the study design.
I analysed 139 eligible UK ecommerce survey responses in SPSS, using Python for supporting analysis and figures. The final dissertation reports the following estimates:
The estimated indirect association through trust was statistically supported, while the direct personalisation coefficient in the joint loyalty model was not statistically significant. The research was cross sectional and cannot establish causal effects or realised commercial improvements.
Source: final individual MSc dissertation, Chapter 4. Raw Qualtrics responses and participant level information are not published.
This figure documents the reported statistical paths, including the indirect association of .303 with its bootstrap confidence interval [.199, .422]. The cross sectional study does not establish causal mediation.
Source: figure from Daniel’s final MSc dissertation. Participant level records are not published.
Explore the model in 3D
Personalisation → trust: B = .575. Trust → loyalty: B = .526. Statistical associations, not proof of causation. Geometry does not encode effect size.
Read the supporting case ↗04 · Decision implications
I translated the analysis into practical next steps.
- Treat trust as both a design criterion and a performance measure for personalisation.
- Explain why personalisation is happening and give customers meaningful control.
- Minimise data use, strengthen security and validate changes through staged experiments.
- Monitor trust alongside verified customer behaviour rather than relying on engagement alone.
05 · Limits
The evidence has defined limits.
This was a cross sectional, nonprobability survey. The findings show statistical associations, not causal effects, and should not be treated as representative of every UK shopper.
06 · Next iteration
I would strengthen the next iteration.
A longitudinal or experimental follow up could test temporal order and causal mechanisms using a broader probability based sample and verified behavioural outcomes.
07 · Attribution
I distinguish my contribution from the complete project output.
This was confirmed individual work. I designed the study, prepared and quality checked the data, ran the analysis and translated the findings into recommendations. Raw participant data is not published.
Toolkit