Predictive Analytics
Which members might leave next?
I compared three classification approaches on a 4,000 record gym membership dataset to identify a model that could support targeted retention decisions.
01 · Decision
I defined the decision before selecting a method.
Which classification approach best identified members at risk of churn, and how could its output support proportionate retention action?
The lowest error rate was the start of a decision, not the end.
I compared 3 classifiers on the same gym membership dataset. The neural network had the lowest validation misclassification at 4.42%, but choosing a retention action requires more than ranking models by a single metric.
The judgement beyond the score
A missed leaver and an unnecessary retention offer have different costs. Test set precision, recall and business cost thresholds would need to be examined before turning a churn score into an operational decision.
02 · Approach
I organised the analysis in the following sequence.
- 01
Imported a gym customer dataset with 4,000 records and 14 attributes into SAS Enterprise Miner.
- 02
Used a 40% training, 30% validation and 30% test partition; no oversampling was reported.
- 03
Built decision tree, logistic regression and neural network classifiers.
- 04
Compared models using validation misclassification and interpreted the strongest displayed decision tree drivers.
- 05
Translated the model output into risk tiers, monitoring and responsible use recommendations.
03 · Evidence
The results support the following interpretation.
The neural network produced the lowest validation misclassification at 4.42%, equivalent to 95.6% validation accuracy. Logistic regression recorded 6.18% and the decision tree 10.52% validation misclassification. The displayed tree highlighted membership length, contract length and visit behaviour among its strongest drivers.
Each hidden unit combines weighted inputs, applies a nonlinear activation and passes the resulting representation forward. Training adjusts the connection weights to reduce classification error on the training partition, while the validation partition tests generalisation during model comparison.
Conceptual schematic based on the modelling method. The submitted evidence does not expose the exact SAS network topology or learned weights.
I trained and compared decision tree, logistic regression and neural network classifiers on 4,000 gym membership records using a 40% training, 30% validation and 30% test split. The submitted presentation reports the following validation misclassification rates:
The neural network’s 4.42% validation error corresponds to approximately 95.6% validation accuracy. The recovered slides also contain separate train, validate and test ROC plots and a lift chart; these do not establish a separately reported numerical test accuracy.
Source: Predicting Gym Membership Churn, individual MSc presentation, slides 6 to 10. The proposed retention and cost reductions in later slides were forecasts, not achieved outcomes.
ROC curves: train, validation and test
The submitted ROC figure compares all three classifiers across separate partitions. It does not give a standalone numerical test accuracy.
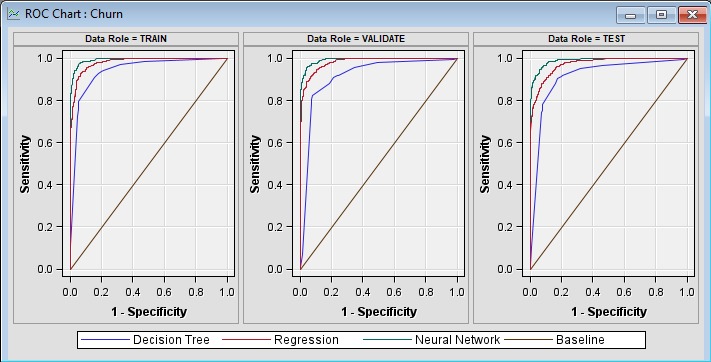
Source: original SAS ROC screenshot recovered from the submitted gym churn presentation.
Cumulative lift on the training partition
This recovered lift chart is labelled TRAIN; it should not be presented as a validation or test result.
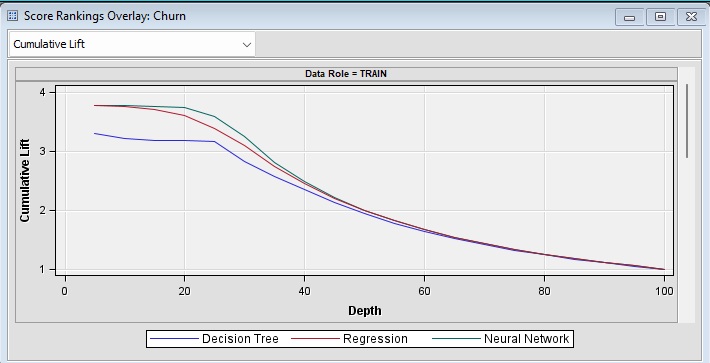
Source: original training partition cumulative lift screenshot from the submitted presentation.
Decision tree structure
The decision tree visual exposes the model’s split variables, including membership length, contract length, current visits and age. This is the decision tree model, not the neural network topology.
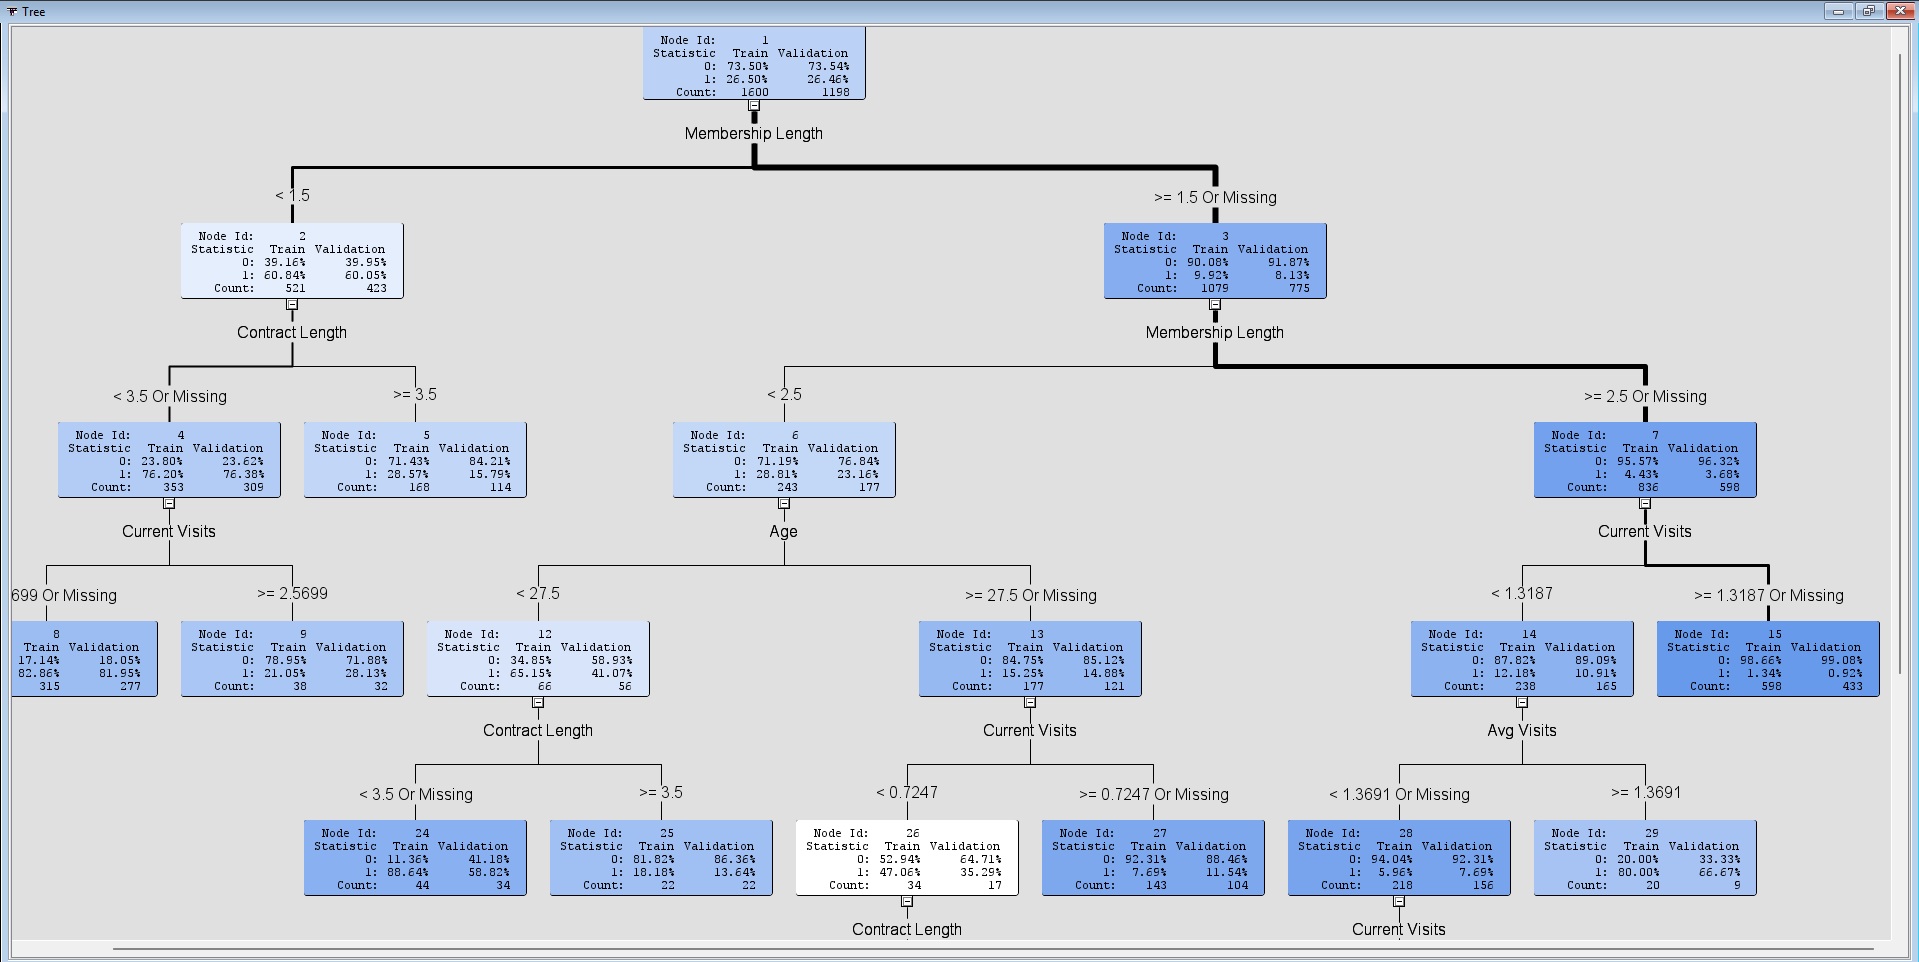
Source: original tree screenshot from the submitted gym membership churn coursework. Open the figure for the small node labels.
Explore the model in 3D
Conceptual architecture only. Node counts and connections are illustrative, not the exact trained SAS network or its weights.
Read the supporting case ↗04 · Decision implications
I translated the analysis into practical next steps.
- Use risk tiers to guide interventions rather than treating every flagged member in the same way.
- Watch early tenure and declining visit signals and connect scores to appropriately timed CRM workflows.
- Retain human review and monitor model fairness, drift and business performance.
05 · Limits
The evidence has defined limits.
Model selection was based on validation performance. This was not a production deployment, and no achieved churn, revenue or cost improvement is claimed.
06 · Next iteration
I would strengthen the next iteration.
Document preprocessing fully, compare test set precision, recall and F1, assess business cost thresholds and add explainability before any operational use.
07 · Attribution
I distinguish my contribution from the complete project output.
This was confirmed individual work. I built and compared the three models, interpreted their validation results and developed the business and responsible use recommendations.
Toolkit